Financial fact sheet
Key figures (IFRS)
| Financial results | 2018 | 2019 | 2020 | 2021 | 2022 | 2023 |
|---|---|---|---|---|---|---|
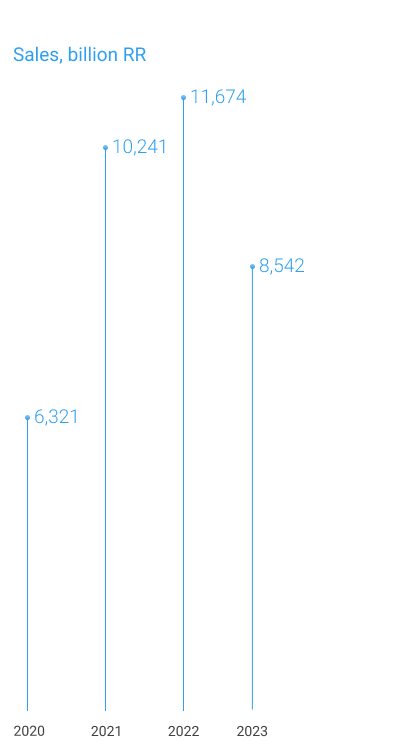
| Sales, million RR | 8,224,177 | 7,659,623 | 6,321,559 | 10,241,353 | 11,673,950 | 8,541,818 |
| Sales profit, million RR | 1,930,030 | 1,119,857 | 614,851 | 2,411,261 | 1,935,159 | 363,689 |
| Adjusted EBITDA, million RR | 2,599,284 | 1,859,679 | 1,466,541 | 3,686,890 | 3,637,555 | 1,764,554 |
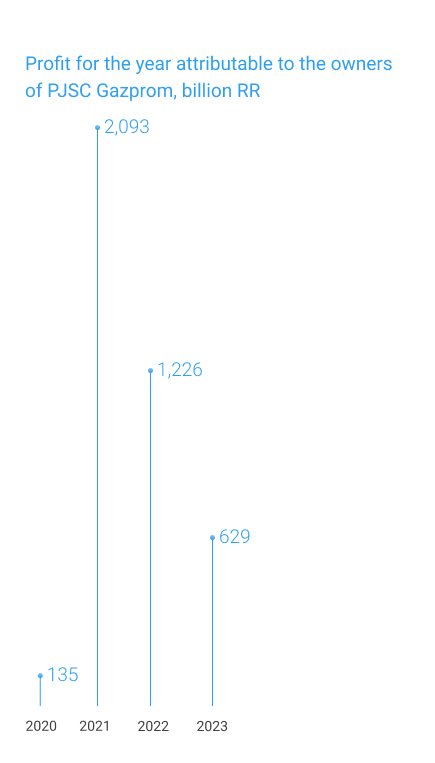
| Net profit attributable to owners of Gazprom, million RR | 1,456,270 | 1,202,887 | 135,341 | 2,093,071 | 1,225,807 | 629,085 |
| Equity, including non-controlling interest, million RR | 13,776,153 | 14 615,687 | 14,804,732 | 16,866,579 | 16,445,845 | 16,452,714 |
| Short-term borrowings, promissory notes and current portion of long-term borrowings, million RR | 569,061 | 774,202 | 693,534 | 697,046 | 709,268 | 1,295,363 |
| Long-term borrowings, promissory notes, million RR | 3,294,761 | 3,089,702 | 4,214,080 | 4,186,656 | 4,356,593 | 5,362,117 |
| Capital expenditures, million RR | 1,639,474 | 1,775,923 | 1,522,565 | 1,933,766 | 2,191,642 | 2,422,017 |
| Net assets per share, RR | 581.9 | 617.4 | 625.4 | 712.5 | 694.7 | |
| Earnings (loss) per share attributable to the owners of PJSC Gazprom, RR | 65.89 | 53.47 | 5.66 | 88.07 | 51.11 | (27.58) |
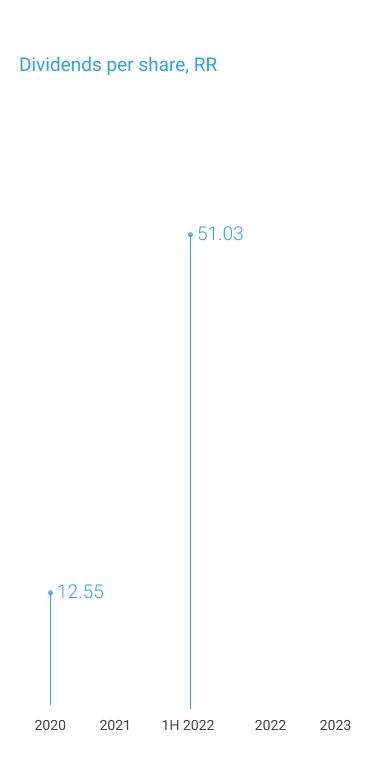
| Dividends per share, RR | 16.61 | 15.24 | 12.55 | – | 51.03 (1H 2022) – (2022) |
– |
| Financial ratios & Market indicators | ||||||
| Return on equity, % | 12 | 9 | 1 | 14 | 8 | 4 |
| Return on Assets, % (ROA) | 8 | 6 | 1 | 9 | 5 | 2 |
| Return on operating profit, % | 23 | 15 | 10 | 24 | 17 | 4 |
| Liabilities-to-equity ratio, % | 51.1 | 49.7 | 57.7 | 60.4 | 58.9 | – |
| P/E ratio (loss) | 2.3 | 4.8 | 37.6 | 3.9 | 3.2 | (5.8) |
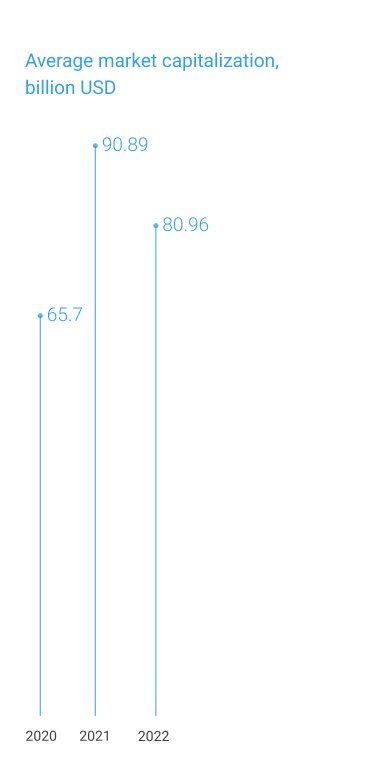
| Average market capitalization, billion USD | 55.6 | 76.4 | 65.71 | 90.89 | 80.96 |
 |
 |
 |
 |